Data Analysis
Jupyter/IPython Notebooks
What are Jupyter Notebooks?
Interactive Python notebook/environment
Popular for Data Analysis and rapid prototyping.
Advantages of Notebooks
Built to integrate well with markdown, latex, pandas, matplotlib, etc
Non-linear nature means that we can run any cell at any time
Displays the result of the last expression
Disadvantages of Notebooks
Built to integrate well with markdown, latex, pandas, matplotlib, etc…Which means that it is not meant for long form code-style correction
Not meant for instances where modules or libraries need to be created
Non-linear nature means that we can run any cell at any time…Which can be confusing and difficult to debug
Displays the result of the last expression…Which means that sometimes the output what we want to see and may be difficult to debug.
Important Points
Kernel - "Computational engine" that runs the code in a notebook
Due to the nature of IPython notebooks, the kernel may begin to consume more resources than we intend it to.
Some helpful shortcuts:
Shift - Enter = Runs Cell and creates new one if there is no cell beneath it.
Ctr - Enter = Runs Cell.
Pandas
What is Pandas?
Open source library meant for data analysis and data manipulation.
Lets you create DataFrames from different data types that you may already be working with (csv, text, Excel, etc).
Lends itself to data manipulation (data wrangling) and data analysis purposes.
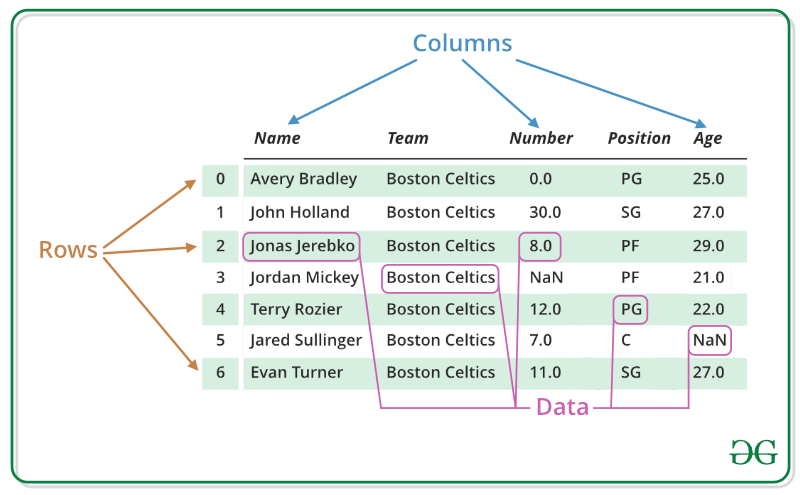
DataFrames
2-dimensional labeled data structure with columns of potentially different types.
You can think of them like a spreadsheet containing data
They have indexes (row labels) and headers (column labels)
DataFrame Example
Getting Basic Information from a DataFrame
The functions you need to know are:
.head()
Will print the first 5 rows of the dataframe by default
Takes an optional argument for number of rows to print
.tail()
Will print the last 5 rows of the dataframe by default
Takes an optional argument for number of rows to print
Getting Basic Information from a DataFrame (contd)
The functions you need to know are:
.info()
Returns information on the columns present in the dataframe, the amount of rows in the dataframe, and the datatypes.
.describe()
Will return basic descriptive statistics such as counts, mean, standard deviation, min, max and quartiles.
Pandas GroupBy
It is important to understand how to navigate documentation.
There are way too many methods with way too many arguments to memorize.
GroupBy Method
Subsetting and Other Methods
There are simply too many Pandas methods to memorize.
Luckily we have a very helpful resource.
Potential Scenario
Let’s say that someone comes up to us and asks:
“Is there any way that I can get a dataset where I can see the mean budget, profit, and popularities for action movies for each production company that played a secondary role in production?”
Dataset:
Contains data on production company, budgets, and genres for 5000 movies.
Data Visualizations
Using Pandas
Pandas conveniently has methods that we can use in order to plot data that we might be interested in seeing.
Under the hood, Pandas is using a library called Matplotlib
Matplotlib is a library specifically made for data visualizations.
Can be difficult to use.
The Important DataFrame Methods
Scatter
Bar Graph
Histograms
Alternatives: Seaborn
We have been using methods built into pandas in order to create data visualizations.
These methods are dependent on matplotlib
Matplotlib can get complicated to use for more complex visualizations.
Seaborn tries to fix that issue by simplifying the process for making complex visualizations that look good.
Statistics and DataScience
SciPy
Package used for scientific computing
Part of the code packages that make up the "SciPy" ecosystem.
Exosystem of packages that are particularly useful in science applications
These packages include matplotlib, pandas, and numpy
Some Important Statistical Tests
Correlation Testing
Z-Score
T-Test
ANOVA
Correlation Testing
Used to evaluate the association between two or more variables.
Z Score
Z tests are used to determine if two sample means are different
Z scores is a number representing how many standard deviations a datapoint is from the sample mean.
We can use [Z Score Tables](http://www.z-table.com/) to manually convert Z-Scores to find the percentage of observations that we expect to see to the left of the curve.
We can also use scipy to do this for us.
T Test
Used to determine if the means of two sample groups are different.
ANOVA
Tests if two or more groups have the same population mean.
Statsmodels
Statsmodels is a Python module that provides classes and functions for the estimation of many different statistical models, as well as for conducting statistical tests, and statistical data exploration.
Linear Regression
Modeling of the relationship between a dependent variable and one or more independent variables.
We are interested in using statsmodels to create linear regression models.